In technical analysis, triangle patterns are formed by trend lines that meet at an apex, or corner, as price ranges converge. The top of the triangle is a trend line connecting highs in price, while the bottom of the triangle connects the lows. The apex is formed by where the upper and lower trend lines meet. There are three main types of triangle pattern: ascending, descending, and symmetrical.
In an ascending triangle, high prices remain at a consistent resistance level, while lows gradually get higher. In this case, the top of the triangle is a nearly horizontal line, while the bottom slants upward. Ascending triangles are usually bullish: as the price ranges converge, a new high will be reached, and the old high will become the new support level.
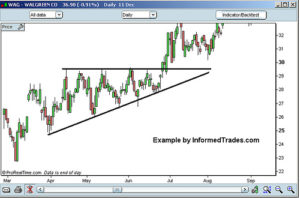
An example of an ascending triangle. Image Credit: Commontrader (CC bys SA-3.0)
A descending triangle is the opposite pattern: lows remain consistent while highs gradually get lower. The bottom of a descending triangle is horizontal, while the top slants downward. Eventually, the pattern will breakdown, forming a new low price, making the old low the new resistance level.
A symmetrical triangle is formed when both high and low prices get closer and closer together, meeting in the “middle.” Investors must speculate whether this pattern will breakout into an uptrend, or breakdown into a downtrend.
Recent Comments