In technical analysis, a moving average (MA) is an indicator used to monitor price action while filtering out “noise” from random price fluctuations. Since it is based on past prices, moving average is termed a lagging or trend-following indicator.
There are two main ways to calculates moving average: simple and exponential. In a simple moving average (SMA), the closing prices for each day in the period are added together, and then divided by the number of days. For instance, Jan’s Grocery closed at $5, $5, $6, $7, and $7 over the course of the previous five days. The sum of these prices is $30, making the average price $6 over the five-day period. On the next day, the earliest price ($5) is replaced by the closing price of the previous day, which in this case was $10. The new average becomes $7, making 7 the next data point in the moving average, and so on. Exponential moving average (EMA) works in a similar way, but is calculated putting more weight on more recent prices.
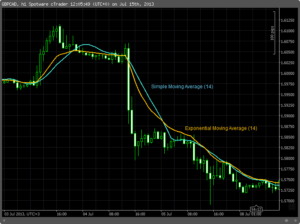
Simple (blue) and exponential (orange) moving average graphed in relation to a candlestick chart (green).
Moving average can be calculated over any period of time; longer periods are more useful to long-term investors, and shorter periods are more useful to short-term investors. 50-day and 200-days MAs tend to be the most commonly used. A rising moving average usually indicates an uptrend, while a declining moving average can indicate a downtrend. Crossover between long-term and short-term moving averages is also an important indicator. A short-term MA crossing above a long-term MA indicates a bullish trend, while a short-term MA crossing below a long-term MA can signal a bearish trend.
Recent Comments