In a previous article, we covered the basics of candlestick charts. Today we look at a particular feature of candlestick charts known as a doji. The term comes from the original 16th century Japanese rice trading system on which candlestick charts are based.
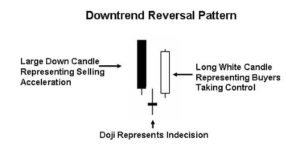
A doji in a downtrend reversal pattern. Image Credit: Commontrader (CC by 3.0)
A doji candlestick forms when the opening and closing prices of a stock are virtually the same over the given period. A neutral pattern, it appears on the chart as a cross-like shape since the “body” of the candle is so small. Auction theorists view doji as a point of indecision for both buyers and sellers, resulting in a standoff. A doji usually indicates that a reversal of the current trend is about to occur, going from a bullish to a bearish stock or vice versa. However, doji can also occur during a period of consolidation right before a price breakout.
There are also several important variations on the doji. A long-legged doji occurs when there is a wide range of movement of the price throughout the day, meaning their is more indecision about the asset’s future. A gravestone is when the opening and closing prices are near the day’s low, and a dragonfly is when they are near the day’s high. Both can indicate a major turning point for the stock.
Recent Comments